Investment Return on Pension Assets in 2024
Prefunding of assets has gained increasing importance in recent years as a source of pension financing. This trend is driven by population ageing and the associated growth of earnings-related pension expenditure.
International comparisons of pension asset investments have been limited in Finland. The comparative data published by international organisations are often of a rather general nature and do not necessarily take into account the distinctive features of earnings-related pension systems.
The comparison of investment returns is part of a broader effort by the Finnish Centre for Pensions to produce information on the financing of pension provision and highlighting the role of investment operations as one of its key components.
However, the comparison does not allow direct conclusions to be drawn on the success of the investment activities. It is worth noting that large players already established in the market have been included. This is likely to bring well-performing occupational pension investors into the comparison.
Earnings-related pension investors divided into two groups
Our comparison of investment returns includes 24 pension sector providers from Northern Europe, North America and Asia. They are all major pension investors in their respective pension systems, both in terms of coverage and investment assets. The comparison has been carried out since 2018 and is updated annually. As a rule, the actors involved have remained the same.
Pension investors are divided into two categories: those subject to solvency regulations and those subject to their own investment regulations, i.e. buffer funds. In Finland, the solvency regime applies only to private sector occupational pension insurers, i.e. occupational pension companies, pension funds and foundations (see TELA for more details).
In other countries, occupational pension providers follow similar solvency rules, either national or pan-European (Solvency II). The occupational pension companies and funds in this comparison apply their own national regulatory frameworks (see details for each pension investor).
Provider specific investment regulations (buffer funds)
- the Swedish buffer funds (AP1-AP6),
- the Canada Pension Plan Investment Board (CPPIB),
- the Norwegian Government Pension Fund Global (SPU),
- the Japanese Government Pension Investment Fund (GPIF),
- the National Pension Service of Korea (NPS),
- the Finnish public sector pension provider Keva,
- the Finnish State Pension Fund (VER) and
- the Finnish Church Pension Fund (KER).
Investors subject to solvency regulation
- the California Public Employees’ Retirement System (CalPERS),
- the Dutch Pension fund for employees in the government and education sectors (ABP) and the Dutch pension fund for the care and welfare sector (PFZW),
- the Swedish occupational pension funds Alecta and AMF,
- the Danish occupational pension fund ATP and the Industrial Employees’ pension fund IP
- the Finnish earnings-related pension insurance companies (Elo, Ilmarinen, Varma, Veritas), and
- the Seafarers’ Pension Fund (MEK).
The comparison covers investment returns over a one-year to 15-year periods. The figures can be freely selected from the database for 2008 and onward. In addition, our comparison includes data on pension asset amounts and investment allocations for the last year. The comparison is updated annually.
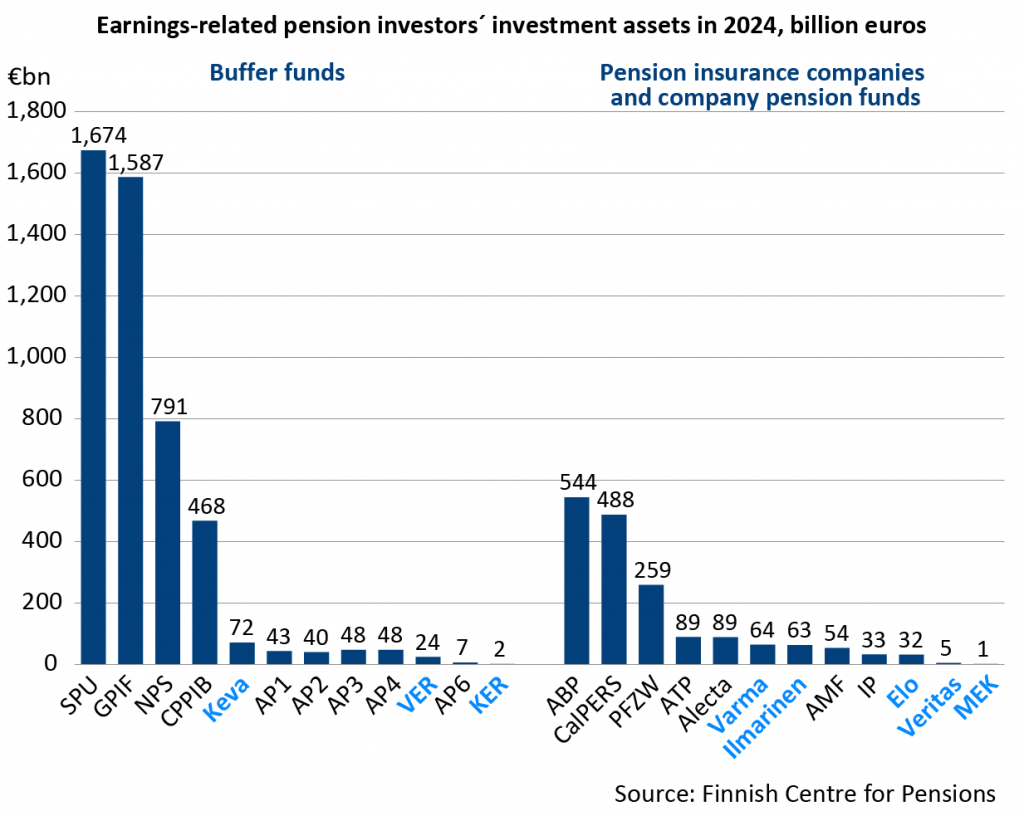
Earnings-related pension investors’ assets
Differences in the asset levels of the operators are explained by differences in the funding technique of the schemes and differences in the size of the schemes in terms of the number of insured persons and pension beneficiaries.
In Finland, for example, the occupational pension system is partly funded and implementation is decentralised to several different actors. In Sweden, the statutory pension scheme is also partly funded and the buffer fund is decentralised to several actors (AP1-AP6). This keeps the size of a single actor relatively small. Occupational pensions are fully funded, but their role is complementary to the statutory occupational pension.
The Netherlands also has a decentralised occupational pension scheme, but it is fully funded and provides virtually the entire earnings-related pension, which is reflected in the country’s substantial pension assets. Although there are many occupational pension providers, assets are concentrated in the larger players, of which ABP and PFZW are the two largest.
In Japan (GPIF), South Korea (NPS), Norway (SPU), Canada (CPPIB), buffer funds are responsible for the centralised funding of the statutory occupational pension scheme. The Norwegian fund is the largest investor in this comparison and also the largest fund in the world.
Pension assets are converted into euros at the year-end exchange rate and, for CalPERS, at the exchange rate on the last day of the financial year (30th June).
Earnings-related pension investors’ real returns in 2024
The data on return rates are collected from public sources, primarily financial statements and annual reports. For Canada and Japan, annual return rates are calculated based on quarterly statistics. The figures indicate net returns after expenses and are presented in the national currency.
Long-term average returns are calculated as a geometric average of annual rates of return. Calculations of real return use the average value of OECD Stat’s Consumer Price Index (CPI) for the investment year. In addition to real returns, also nominal returns can also be extracted from the database.
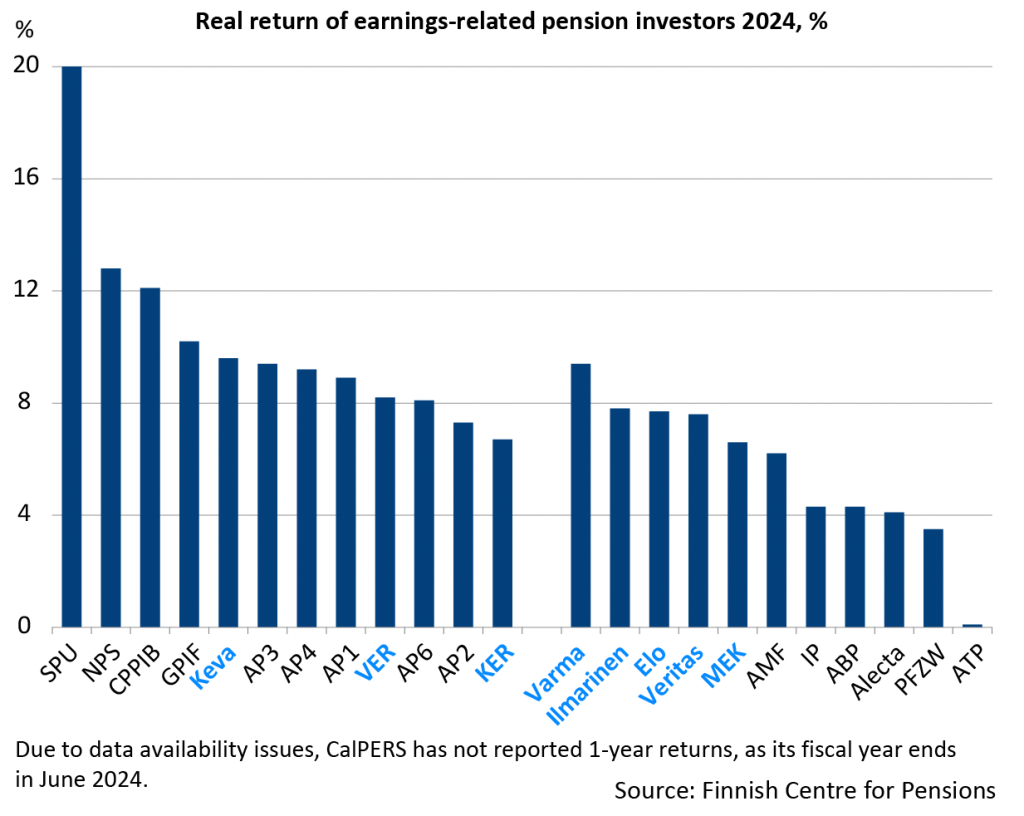
In 2024, the average nominal return for pension investors was 9.5 % (8.2% in 2023). The average real return was 8.0 % (2.1%). By far the highest annual returns were achieved by the Norwegian buffer fund SPU with 20.0% return, followed by the Korean NPS with 12.8% return.
In Finland and Sweden, inflation was higher than average during the year and this was also reflected in real returns. The real return for Finnish investors was 8.0 (-0.2) percent. The return for ATP was the lowest in the peer group at 0.1 percent.
Factors affecting returns
The comparison shows the annual returns of the different investors. The following factors are particularly important for investment performance:
- Allocation of investment assets
- Solvency regulation and other regulations limiting the risk of investment activities
- Currency area and exchange rate fluctuations
o Returns are expressed in national currency, i.e. the same currency in which pensions are paid - Inflation
o Real returns give a more comparable picture by including price changes - Investment costs
Allocation of investment assets 2024
Pension insurers’ investment assets are divided into three categories: equities, investments in fixed-income securities and other investment instruments. This is a rather crude classification but, nonetheless, it allows for better comparability than the increasingly multidimensional classifications adopted by many pension insurers themselves.
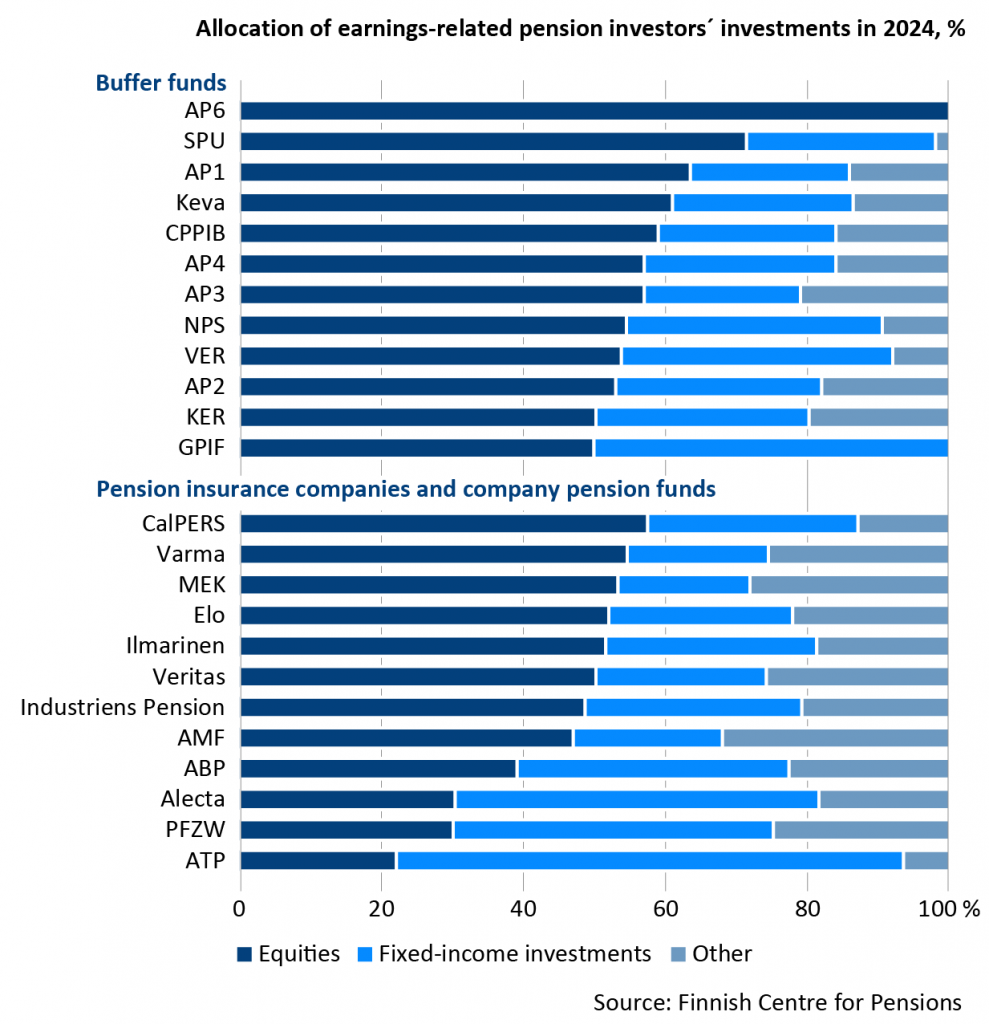
The share weights of the allocations ranged from 100 percent for the AP6 fund to 22 percent for ATP. On average, buffer funds have higher equity weights (61%) than investors subject to solvency regulations (45%). The equity category also includes private equity. The average equity-weight for all investors was 53 percent.
The share of fixed income in investment allocations is highest for ATP (71%). The average share of fixed income investments was 34% for those under solvency regulations and 28% for buffer funds. Both government and corporate bonds and other fixed income investments are included.
The most important types of investments in the other category are real estate, commodities, infrastructure and hedge funds.
Data by investment category are generally year-end, but for CalPERS and CPPIB the data are as of the end of the financial year – end of June for CalPERS and end of March for CPPIB.
Solvency regulations contribute to the ability and willingness of pension insurers to take investment risk. Regulations are designed to protect pension assets and benefits. Solvency is measured by the ratio of assets to liabilities. When solvency is good, i.e. when assets are high relative to liabilities, insurers are able to seek higher returns on riskier investments. Conversely, in a weaker solvency situation, solvency requirements effectively steer investments away from equities and towards fixed income and other lower-risk assets.
Buffer funds without pension liabilities, also have their own investment rules and regulations that for example limit the allocation of investments across asset classes. These vary both between countries and between operators. For example, there may be restrictions on the proportion of shares or real estate investments in the portfolio.
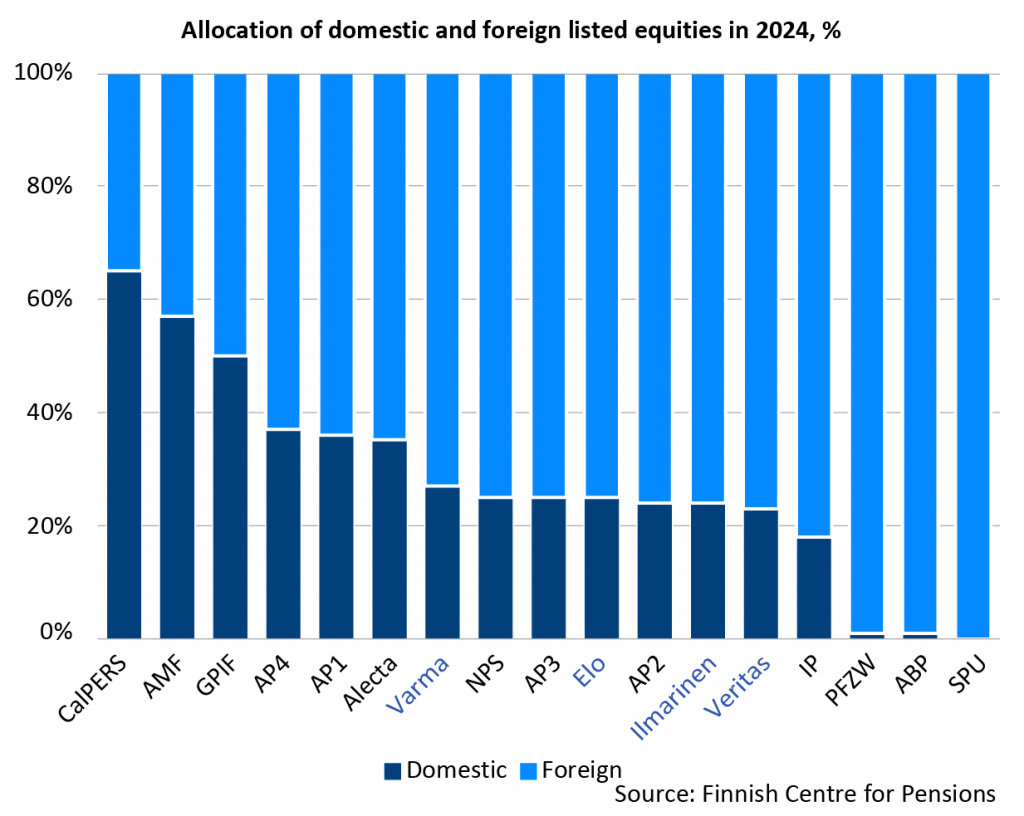
Geographical distribution of equity investments in 2024
As a rule, the providers invest most of their assets outside their home country, with the aim of both diversifying risk and seeking better returns. Globally, pension assets are invested to varying degrees in North American and European markets. Returns are also sought in Asia and emerging markets.
There is no uniform reporting policy on geographical distribution, but the geographical distribution of listed equities is shown below, based on available data. Not all operators report a geographical breakdown by asset class.
The Norwegian pension fund SPU invests all its assets abroad according to its investment guidelines. Almost half of its equity investments were in the United States. The Dutch ABP pension fund also has almost all its equity investments abroad, and the proportion of US equities is also high. Around 75% of the Finnish pension insurance companies equity portfolio was invested abroad.
At the other end of the scale are the Swedish pension fund AMF and the Californian pension fund CalPERS, which had the highest domestic equity weighting in the comparison with over 60%.
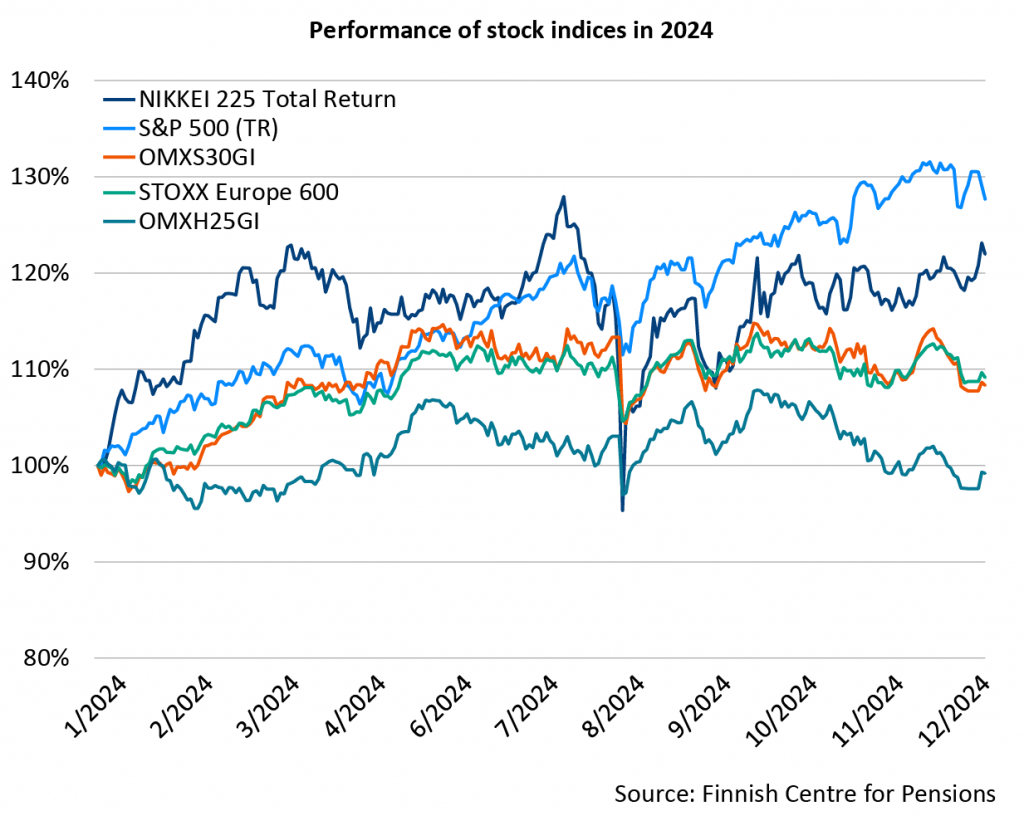
Performance of stock indices in 2024
The performance of different countries and regions can be viewed through stock market indices, for example. The stock indices in the graph are total return indices in domestic currency, which take into account not only stock prices but also dividend yields.
Equity market performance has varied significantly by country and by region in 2024. The Helsinki Stock Exchange’s returns remained weak compared to other stock markets. From the beginning of 2024 to the end of the year, the OMXH25GI index had a negative total return of around 1%. Over the same period, European equities (STOXX Europe 600, €) and Stockholm Stock Exchange equities (OMXS30GI) returned around 9%.
In Japan, the N225TR index has risen by almost 22% over the year and in the US the S&P500TR by 28%. Particularly noteworthy is that the development during the last quarter of the year diverged between economic regions.
For example, the high equity weighting of the Norwegian pension fund SPU, a large proportion of which was invested in the US stock market, helps to explain its high annual return. Similarly, the Japanese GPIF’s return was boosted by strong domestic stock market performance.
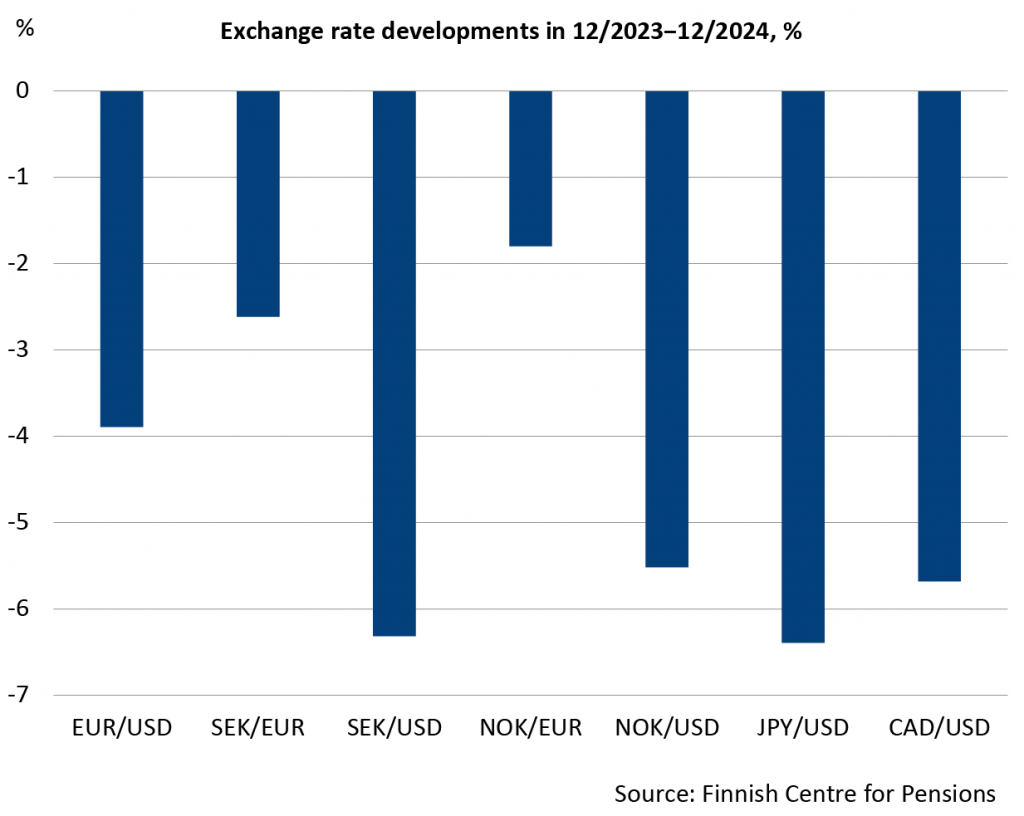
Exchange rate developments in 2024
In addition to the evolution of the nominal value of shares and the dividend yield, the return on the foreign investments is also influenced by the evolution of the exchange rates between currencies. In other words, when the value of the currency of a foreign investment asset changes in relation to the operator’s home currency, this affects the return on the investment calculated in the national currency. In this comparison, returns are expressed in national currency, as pensions are also paid in national currency.
Thus, for example, for euro area operators, a strengthening of the US dollar against the euro will increase the return in euro on assets invested in the United States. Conversely, if the euro strengthens against the dollar, this will reduce the returns on dollar-denominated investments. Investors are therefore exposed to exchange rate risk when investing in non-domestic currency areas. However, exchange rate risk can be mitigated, inter alia, by currency hedging (see below).
In 2024, the US dollar strengthened against all the currencies, contributing to an increased dollar investment returns for other currency area investors. For Swedish operators, the domestic currency depreciated by over 6% against the US dollar and slightly against the euro. The Norwegian krone depreciated significantly against both the dollar and the euro, giving the SPU, which invests broadly in these currency areas, a large positive exchange rate impact on its investments. The Japanese GPIF also benefited from a significant depreciation of the yen against the dollar.
Pension investors often hedge their investments in different currency areas, either fully or partially. This allows the operator to reduce currency risk, for example by using currency derivatives to lock in the exchange rate at a certain level.
In this way, it is possible to avoid a possible negative impact of exchange rate movements on investment returns. On the other hand, it is also possible to seek a return from exchange rate fluctuations, in which case the hedging may be less significant. Hedging may also be omitted if the costs are deemed to be excessive in relation to the benefits. This may be the case, for example, if there is a significant interest rate differential between countries.
In general, for fixed income and other less volatile asset classes, hedging is often comprehensive because the exchange rate risk can be significant relative to their return. Similarly, for equities, hedging can often be left to a lesser extent.
In terms of the investors in this comparison, ABP’s investment strategy has a partial hedge for equities and full hedge for fixed income, for example. Investment regulation may also impose requirements on the level of exchange rate risk. For Swedish AP funds, the currency risk is limited by regulations to a certain maximum level of the investment assets. These restrictions thus imply in practice a comprehensive currency hedging when funds invest a significant part of their assets abroad.
The impact of inflation on real earnings
Investment returns are best compared in real terms. Real return refers to the difference between the return and the change in the price level, i.e. inflation. The difference in the change in price levels can be significant in different currency areas, but also in the euro area inflation can vary widely between countries. The impact of inflation is more pronounced in the long run, but even over a period of one year the difference can be significant.
Annual inflation figures at the end of the year (financial year for CalPERS) has been used to calculate the real return based on the OECD.Stat country-specific Consumer Price Index (CPI).
Although inflation in 2024 fell in almost all countries compared to the previous year there was still a high variation between countries. In 2024, inflation in the countries of the comparison ranged between 0.7% and 4.1%. The inflation figures used for 2024 comparison are shown in the table below.
| Country | Year-end inflation 2024, % |
|---|---|
| Netherlands | 4.10 |
| Japan | 3.65 |
| Canada | 1.83 |
| Korea | 1.93 |
| Norway | 2.20 |
| Sweden | 0.82 |
| Finland | 0.70 |
| Denmark | 1.89 |
| United States* | (2.97) |
Investment costs
Returns are also affected by investment costs. The amount of costs is essentially influenced by the structure of the investment portfolio. Typically, private equity and other alternative investments have high expenses compared to listed equities or fixed income investments.
In addition, the extent to which investment activities are managed by in-house staff and the extent to which activities are outsourced to investment companies, which can have high costs, also affects costs. Outsourcing may also make it difficult to measure costs. However, it is worth noting that even with high costs, alternative investments and outsourcing can also provide higher returns, resulting in a high net return (see for example Investment costs – TELA).
According to the financial statements of the foreign pension investors in this comparison, investment expenses ranged from 0.1% to 1.1% of capital between 2021 and 2023, based on available data. According to the Financial Supervisory Authority’s estimate for 2021, the average investment costs of Finnish pension insurance providers were 0.9% (Thematic estimate of investment costs 2020 (finanssivalvonta.fi)
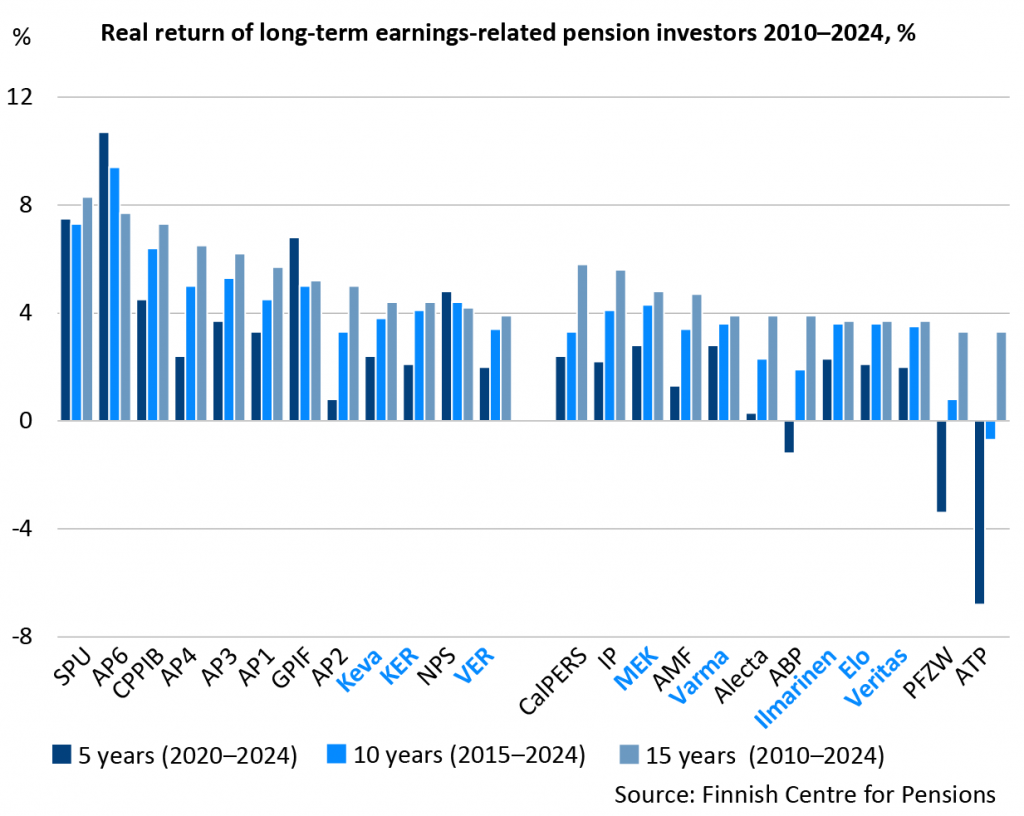
Real returns for the 2010-2024 periods
Pension investing is a long-term activity, so it makes sense to track returns over time, even beyond one year. In this comparison, investment returns are presented not only for the most recent reference year, but also for the preceding 5, 10 and 15-year periods. In addition, the online application allows you to view investment years or different time periods since 2008 (see link below).
Five-year returns (2020-2024) are generally lower than longer-term returns. This is influenced heavily by the year 2022, which was the worst investment year since the 2008 financial crisis. The average five-year return for all investors was 2,4% (3.4).
Ten-year (2015-2024) returns were 4.0 % (4.4) on average. Over the longest 15-year period (2010-2024), the average return rose to 5.0 percent (5.3) percent.
Buffer funds have generated higher real returns than occupational pension companies and funds over the 15-year period, averaging 5.7 % (6.1%). The Norwegian buffer fund SPU, with a real return of 8.3%, has generated the highest real returns.
The 15-year real rate of return for occupational pension companies and funds was around 4.2% (4.5%). The highest return was 5.8% for CalPERS. Among Finnish investors, the highest real returns were achieved by MEK, the Seamen’s Pension Fund, 4.8% and KER, the Church Pension Fund, and Keva with returns of 4.4%.
The Netherlands has a pension system that is built around a national pension and supplementary occupational pensions. Entitlement to the national pension AOW is based on residence. The earnings-related pension system consists of collective supplementary occupational plans agreed between employers and employees. Supplementary pensions are fully funded and cover around 90 per cent of all employees. Supplementary pension cover is primarily a defined benefit system and is mostly provided through major sector-specific funds.
ABP
Founded in 1922, ABP (Stichting Pensioenfonds ABP) is a pension fund for public sector and education employees. It has some 1.1. million active insurees and 0.95 million pension recipients. ABP awards defined old-age, disability and family pension benefits.
ABP is the Netherlands’ biggest pension fund, accounting for around 30 per cent of total assets in the pension fund sector.
PFZW
PFZW (Stichting Pensioenfonds Zorg en Welzijn) is the Dutch pension fund for the care and welfare sector. Established in 1969, it currently has some 1.2 million active insurees and 0.44 million pension recipients. PFZW awards defined old-age, disability and family pension benefits.
PFZW is the Netherlands’ second largest pension fund, accounting for around 15 per cent of total assets in the pension fund sector.
Investment regulation
Collective supplementary pension provision is primarily regulated by the Pensions Act (Pensioenwet). The Act stipulates that supplementary pensions are fully funded, but there are only relatively few direct quantitative rules or restrictions relating to investment. Regulation is largely guided by the Prudent Person Principle, which is based on qualitative criteria.
Another significant part of investment regulation is the risk-based financial assessment framework (financieel toetsingskader FTK), the aim of which is to ensure the full funding of pension liabilities by guaranteeing the necessary amount of assets with the risks encountered or taken by the fund.
FTK regulations require that pension funds’ assets and liabilities are assessed on a market basis. Liabilities are valued using the euro swap curve and the ultimate forward rate (UFR).
Pension funds are expected to guarantee with 97.5 per cent probability that they have sufficient assets to meet their non-indexed liabilities for one year. The riskier the fund’s investments, the more assets they should have relative to liabilities. For most pension funds the solvency requirement is in the region of 120–130 per cent. If the solvency ratio is under 110 per cent, pension funds may not index-link their benefits. Funds are required to cut pensions if their solvency ratio remains below 105 per cent for five consecutive years.
In recent years funding ratios have fallen short of the indexation threshold, mainly as a result of interest rates falling to extremely low levels. Coupled with rising life expectancy, interest rate trends have driven up the amount of liabilities relative to assets.
The South Korean statutory pension system is partly funded. The National Pension Fund was created in 1988 in connection with the launch of the national pension service.
Surplus from contribution revenue is set aside in pension funds for purposes of future pension expenditure. The latest calculations indicate that pension assets will dry up by 2060 unless reforms are put in place to strengthen the financing of the pension system.
The National Pension Fund is the third largest in the world. At year-end 2018 the value of its investments amounted to 34 per cent of GDP. In recent years the fund has stepped up its investments in equities and in foreign countries.
Japan’s statutory pension system is partly funded. Pensions are financed from pension insurance contributions, state funds and returns generated by the pension fund.
The Government Pension Investment Fund is the world’s largest pension fund. At the end of 2018 the value of its investments amounted to around 27 per cent of GDP. The fund has been in operation in its current form since 2006.
GPIF realigned its investment strategy in October 2014 when it decided to reallocate its investments from domestic bonds to equities and to increase the share of foreign investments. The fund set itself the target of increasing the share of domestic and foreign equity investments from one-quarter to one-half of its portfolio. Its equity investments are divided half and half between domestic (+/- 9%) and foreign (+/- 8%) companies, as before. The weight of domestic bonds was reduced from 60 to 35 per cent (+/- 10%), and the share of foreign interest-bearing papers was increased from around 11 to 15 per cent (+/-4%).
Statutory pension security in Canada consists of the federal earnings-related Canada Pension Plan (CPP) and the national pension system known as Old Age Security (OAS). The CPP programme is financed from pension contributions and by means of funding, the OAS programme is financed from tax revenues.
Labour market pension plans and individual supplementary pensions contribute significantly to overall pension security because benefits under the statutory systems are relatively modest and limited.
CPPIB
CPP pension assets are invested by the Canada Pension Plan Investment Board (CPPIB). CPPIB was founded in 1997 with a mandate to secure the long-term sustainability of the earnings-related pension system. Excess revenue from pension contributions is paid into the fund. CPPIB has leaned heavily towards equity investment from the earliest years of its operation.
At the end of March 2018 CPPIB had net assets worth around 224 billion euros (CAD 356 billion). It is the world’s eighth largest pension fund in terms of investment assets, which amount to around 20 per cent of GDP.
Investment regulation
CPPIB investment activities are governed by the Canada Pension Plan Investment Board Act, which says that the CPPIB’s mandate is to
- manage assets in the best interests of contributors and beneficiaries
- maximise long-term returns without excessive risk-taking and with due consideration to factors that have a bearing on the financing of the CPP system and the payment of benefits
- assist the CPP system in the financing of benefits
CPPIB investment policy complies with the prudent person principle, but to fulfil its statutory roles and functions the Board sets out more detailed instructions and guidelines in its Investment Statement.
The CPPIB’s Investment Statement says that the risk exposures of the actual Investment Portfolio shall be in line with the risk target as expressed in the Reference Portfolio, which also reflects the minimum expected return rate of investment activities. The allocation of the Reference Portfolio is as follows:
- 85 per cent private equities (Global public large/mid cap equity, including Canada and emerging markets)
- 15 per cent fixed-income securities (Canadian Federal and Provincial Governments Nominal Bonds)
The Reference Portfolio is expected to yield a minimum return of 3.9 per cent. The target return rate for the Investment Portfolio is higher due to active portfolio management and more efficient portfolio allocation.
The Investment Portfolio should be largely invested outside of Canada, although interesting-bearing papers should be predominantly Canadian. Hedging is not generally used to manage exposure to exchange rate risks emanating from the emphasis on foreign investment. The aim of this is to spread the investment risks in relation to the Canadian dollar and thereby in relation to oil and other commodity prices.
The Norwegian pension system is built on the foundation of a National Insurance Scheme (Folketrygden), which pays out residence-based basic pensions and occupational pensions. Occupational pensions (tjenestepensjonsordninger) became mandatory in 2006 and now cover virtually the whole labour force. AFP supplementary pensions provide additional pension cover for around one-half of private sector and almost all public sector employees.
Government Pension Fund Global
Contributing to finance the National Insurance Scheme, the Government Pension Fund Global (Statens pensjonsfond utland – SPU) accounts for the bulk of Norway’s substantial pension assets. The first payments into the fund were made in 1996 by what was then called the Petroleum Fund of Norway. Fund assets currently (2016) amount to approx. 240 per cent of GDP.
In contrast to ordinary pension funds, SPU assets are routinely used to cover the government budget. Instead of pension contributions, fund revenue consists of cash flows from the petroleum industry. Taxes paid by oil industry companies, state revenue from oil sales and profits from the majority-state owned Statoil are deposited into the fund and used to offset government budget deficits.
In the long term transfers from the fund to the government budget may not exceed three per cent of the current fund value. It is thought that this figure reflects the fund’s estimated medium term real return and therefore will be enough to cover future budget deficits if oil revenue dries up, without the need to dip into the fund’s capital.
The financing of pensions under the National Insurance Scheme is based on a general social insurance contribution, which is also used to finance other social benefits under the scheme. The contributions levied cover around two-thirds of total social insurance expenditure, while the remaining one-third is financed through the government budget, in practice through assets from the pension fund.
Investment regulation
SPU is exempt from solvency funding requirements and has no explicit pension liabilities, yet strict investment rules still apply. Investment activities are regulated by the Ministry of Finance, which establishes SPU’s investment mandate. The main provision under this mandate is that assets shall be invested outside of Norway. In practice, the mandate prohibits investments in Norwegian equities, real estate and bonds. SPU investments are furthermore required to adhere to the ESG principles of responsible investment.
SPU may invest in foreign-listed equities and interest-bearing instruments and in unlisted equities if the board of the company concerned is committed to publicly listing the company. Since 2010 investments in real estate have also been permitted. Derivatives may only be included in the portfolio when they are expressly linked to other investments. The investment mandate also prohibits investment in countries subject to significant economic sanctions. The fund may also not invest in unlisted infrastructure.
According to the SPU investment mandate the equity portfolio shall constitute 60–80 per cent of total investments. Investments in fixed-income securities shall constitute 20–40 per cent and unlisted real estate investments no more than 7 per cent of the investment portfolio. In order to limit credit risks, investments in fixed-income securities with a higher risk rating than BBB may not exceed 1 per cent of the investment portfolio. A minimum of 7.5 per cent of the investment portfolio shall be held in treasury bonds issued by the governments of France, Germany, Japan, the UK and the United States. Furthermore, SPU may not own more than 10 per cent of the voting shares of an individual listed company
The SPU investment portfolio shall be structured in such a way that the expected annualised standard deviation of the return relative to the expected tracking error does not exceed 1.25 per cent. The strategic benchmark index is derived from the FTSE and Bloomberg Barclays indices, with investments in equities and in fixed-income instruments having a weight of 62.5 per cent and 37.5 per cent, respectively. However, the Ministry of Finance has decided to progressively increase the weight of equity investments in the benchmark index to 70 per cent
In Sweden, the statutory old-age pension system is divided into two parts: the income pension (inkomstpension), which is financed on a PAYG basis, and the premium pension (premiepension), which is fully funded and based on . Buffer funds contribute to financing the income pension.
Statutory pensions are supplemented with occupational pensions, which cover around 90 per cent of all employees. Occupational pensions are administered by private companies, foundations, industry-wide pension funds or arranged through book reserves. Three-quarters of total revenue from occupational pension contributions is managed by life insurance companies.
AP buffer funds in the Swedish statutory pension system
Funding of the income pension is shared across five state-owned funds. Old-age pension contributions are paid into the first four of these funds. The sixth AP fund is as a closed fund, with no cash flow movement between the fund and the pension system. It is by far the smallest of the five buffer funds.
Overall pension assets are equivalent to around 30 per cent of GDP. Contribution revenue that exceeds pension expenditure has been paid into the buffer funds since the launch of the earnings-related pension system in 1960.
There furthermore exists a state-owned Seventh AP fund (Sjunde AP-fonden), which is charged with administering the default fund of the third-pillar premium pensions system, which is beyond the scope of this comparison.
Life insurance companies Alecta and AMF
Alecta and AMF are Sweden’s largest occupational pension companies. Alecta administers occupational pensions for private sector employees (ITP), while AMF manages the occupational pension plans negotiated by LO, the Swedish Trade Union Confederation, which covers the blue-collar labour market (SAF-LO). Under both schemes the wage earner can choose not only who they want to manage their pension pot but also their preferred risk level by opting for either traditional pension insurance or a fund pension scheme. Traditional pension insurance guarantees a minimum rate of return, a fund pension scheme does not. In the ITP system, half of the pension contribution must in any case be invested in traditional pension insurance. If the insuree makes no active choice, pension cover is provided through these companies in the form of traditional pension insurance.
SAF-LO pensions have been defined contribution schemes since 1996, ITP (ITP1) pensions have been based on defined contributions since 1997. Alecta administers defined benefit pension security (ITP2) during the transitional period unless the employer provides pension insurance through a foundation or a book reserve system.
Investment regulation
Investment activities by the buffer funds are regulated by law, and the first four AP funds are subject to uniform investment rules. The sixth AP fund is a venture capital investor and is subject to investment rules laid down in a separate law.
The current Act regulating the operation of AP funds came into effect in 2001 in connection with the old-age pension reform. The AP Funds Act specifies quantitative restrictions on investments. Under an amendment that entered into force in 2019, quantitative investment restrictions are eased, among other things, by lowering the requirement of the minimum share of bonds with a low credit and liquidity risk from 30 to 20 per cent and by allowing greater freedom with regard to unlisted equities.
The AP funds are legally sovereign with their own investment and ownership policies and risk management plans. They are obliged by law to submit annual financial reports to the Swedish government. Based on these reports the government, for its part, submits to Parliament an annual summary and appraisal of how the funds have been managed. The funds have set themselves real investment return targets of 4–4.5 per cent.
Alecta and AMF follow the prudence principle in all their investments. Sweden’s financial supervisory authority Finansinspektionen bases its solvency assessments on a national model which is broadly in line with Solvency II principles, although there are some differences in technical detail. For instance, the solvency limit in the national, so-called traffic light model is set at a level whereby the solvency capital requirements are met over a one-year horizon with 97 per cent probability. In Solvency II, the probability of liabilities exceeding assets over one year is stricter at 0.5 per cent (value-at-risk 99.5%). The national regulations enforced during the transitional period were established as permanent practice since January 2020 (see government bill).
- First AP fund (Första AP-fonden)
- Second AP fund (Andra AP-fonden)
- Third AP fund (Tredje AP-fonden)
- Fourth AP fund (Fjärde AP-fonden)
- Sixth AP fund (Sjätte AP-fonden)
- Alecta
- AMF
The Finnish earnings-related pension system is a partly funded defined benefit scheme.
Statutory earnings-related pension system in Finland is administered by several earning-related pension providers. Statutory earnings-related pensions are managed in the private sector by pension insurance companies, special pension providers, company pension funds and industry-wide pension funds and by public sector pension providers.
Our comparison includes pension insurance companies and the Seafarers’ Pension Fund (MEK) from the private sector; and Keva, the State Pension Fund (VER) and the Church Pension Fund (KER) from the public sector.
The general guiding principle for pension providers’ investment operations is to seek profitable and secure investment opportunities. In contrast to the private sector, the public sector pension system is not subject to any specific pension liabilities. Instead it is a buffer fund that is exempt from solvency requirements.
The private sector earnings-related pension system has been partly funded since it was created in 1962. In the public municipal sector, the funding of pension assets was started in 1988 and in the state sector in 1990.
Pension insurance companies and MEK
Pension insurance companies manage earnings-related pension provision for private sector employees and self-employed persons. Statutory earnings-related pensions for seafarers are managed by the Seafarers’ Pension Fund.
A total of some 1.8 million persons are insured with a pension insurance company, accounting for around 70 per cent of all those insured for an earnings-related pension in Finland. In 2017 MEK had over 7,300 seafarers and 8,300 pension recipients on their books.
Part of the future pensions under the private sector pension acts for employees (Employees Pensions Act and Seafarers’ Pensions Act) are pre-funded, the rest are financed through pension contributions according to the PAYG principle.
Buffer funds Keva, VER and KER
Keva is Finland’s largest investor of earnings-related pension assets. It is responsible for funding the pensions of local government employees and for investing their pension assets. Its investment aim is to ensure a predictable and stable level of pension payments for the long-term future.
Under the Act on the State Pension Fund, VER is required to transfer 40 per cent of annual state pension expenditure to the state budget. The assets not transferred remain in the pension fund. In 2013 VER asset transfers to the state exceeded the amount of pension contribution revenue for the first time. VER’s long-term funding ratio target is 25 per cent.
The Church Pension Fund KER manages the pension buffer fund for employees of the Evangelical-Lutheran Church of Finland. It is tasked to ensure the payment of church employees’ pensions and the steady development of pension contributions in parishes. Since 2016 pension payments out of the fund have exceeded incoming pension contributions, and therefore part of the pensions are financed from the fund’s investment returns.
Regulation
The Finnish earnings-related pension system is not subject to the EU Life Insurance Directive or to the Solvency Directive that is applicable to life insurance companies.
Private sector pension providers in Finland are, however, subject to solvency regulation, and they seek to manage their investment and insurance risks through solvency capital, with similar limits applied as are set out in the Solvency Directive.
The riskier the pension provider’s investment allocation, the higher the solvency capital requirement. The solvency limit is set at a level whereby the solvency capital requirements are expected to be met over a one-year horizon with 97 per cent probability.
The solvency rules governing investment activities do not apply to public sector buffer funds. Although there is no corresponding regulation, buffer funds and private sector pension providers are required to ensure that their investments are secure, deliver a high return, are readily convertible into cash and that they are appropriately diversified and spread. The State Pension Fund is subject to more detailed regulation than others because not only does it have to follow the provisions of law, but the Ministry of Finance additionally issues direct instructions concerning its investment operations. Current instructions are that
- fixed-income instruments account for a minimum of 35 per cent
- equity investments for no more than 55 per cent and
- other investments for no more than 12 per cent of the State Pension Fund’s investment portfolio.
In Denmark, statutory labour market pensions supplementing the state pension and covering employees (Arbejdsmarkedets Tillægspension, ATP) is administered by ATP, a private pension provider. This is a fully funded defined contribution scheme. ATP is Denmark’s largest pension fund. Its pension assets amount to around 40 per cent of GDP.
Although it holds significant assets, ATP’s pensions have relatively minor importance in terms of overall pension cover. The old-age pension is not earnings-related. The pension contribution is flat-rate and determined according to working hours. The contribution is the equivalent of around one per cent of average earnings. The average monthly old-age pension is around 200 euros. No disability pensions are payable under the system. Survivors’ pensions are in the form of flat-rate lump sum payments.
Regulation
ATP’s investment operations are governed under a separate act (ATP-loven). The ATP pension scheme is not subject to Solvency II regulation, but its own risk management model is based on the own risk and solvency assessment (ORSA) principles of the Solvency II Directive. ATP regularly reports on its solvency and operations to the Danish Financial Supervisory Authority Finanstilsynet.
ATP’s own solvency requirements are set at the same level as in Solvency II, with the company expecting to remain solvent at 99.5 per cent probability over one year. However ATP’s own minimum capital requirement level is higher than under Solvency II
In the United States, pension provision is based on a statutory federal-wide system called OASDI (Old Age, Survivors, and Disability Program). There is no residence-based national pension system, but pensioners’ minimum income is guaranteed by an income and asset-tested income supplement programme. The OASDI system is financed by revenue from insurance contributions.
Pension arrangements agreed between the employer and employee and individual supplementary pension plans are relatively important to the individual’s total pension income, particularly in the case of middle and high earners, because benefit levels are relatively low under the statutory system. Supplementary pension schemes are fully funded pension security, and in the public sector they cover virtually all employees. In the private sector coverage is much more limited.
CalPERS
Established in 1932, the California Public Employees’ Retirement System (CalPERS) is one of the largest pension funds in the United States, with assets worth around 272 billion euros (2017). In administrative terms CalPERS is a state agency. It has some 3,000 public sector employer members and around 1.9 million individual members, who are civil servants and employees in the public sector,
Investment regulation
CalPERS’s investment operations are primarily regulated by the Board-approved Fund Investment Policy. In line with this policy, the strategic objective of the CalPERS investment programme is to generate returns at an appropriate level of risks so that members and beneficiaries can be provided with benefits as required by law.
The investment policy details four specific return performance objectives:
- the long-term rate of investment return shall meet or exceed the CalPERS actuarial expected rate of return;
- returns shall be maximized for the level of risk taken;
- returns shall exceed the Policy Index; and
- assets shall be invested efficiently, bearing in mind the costs of investment operations.
The policy benchmark consists of the following indices. Their weights correspond to the allocation target for the investment portfolio:
- Listed equity: Custom Global Equity Index, 50%
- Private equity: Custom FTSE All World, All Cap Equity + 150bps, Quarter Lag, 8%
- Interest: Custom Global Fixed Income Benchmark, 28%
- Real estate assets: MSCI Investment Property Databank (IPD) (U.S. Core – Fund Level), 13 %
- Inflation assets: Custom Inflation Assets Benchmark, 0 %
- Liquidity: 30-day Treasury Bill, 1%
The expected annual deviation from the benchmark (standard deviation) may be no more than 1.5 percentage points.
State and local government pension systems shall comply with Governmental Accounting Standards Board (GASB) accounting rules, for instance in calculating the current value of pension liabilities. Under new rules introduced in 2014, pension assets shall be assessed on a market basis and pension liabilities discounted to the present value with respect to the expected return on assets, and in case of uncovered liabilities with respect to local government high-quality bonds.
Read more on Etk.fi: